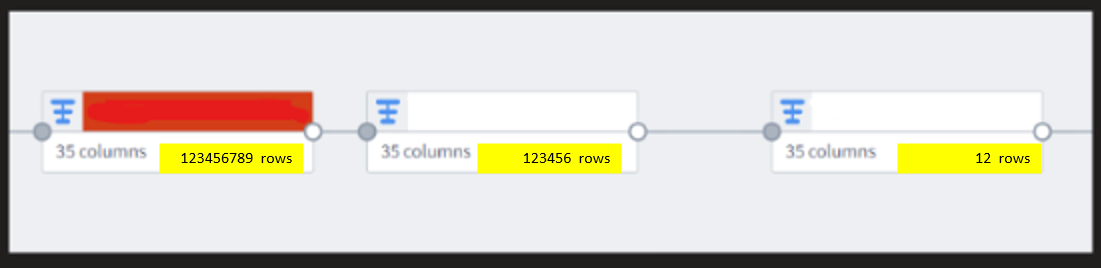
Row count visualization is crucial, far more crucial than column count visualization. To avoid blowing up rows after joins, inadvertently dropping rows etc. we need a less painful way to visualize this in pipeline builder. Right now, rows counts are only visible if you drop into a node and run stats, but it would be amazing if you could hit a button on the node to run it immediately, thereby seeing exactly where rows change. If possible (although compute size may limit) it would be neat as well to periodically schedule a “row count” stats for each node, so that it can be done automatically for all nodes.
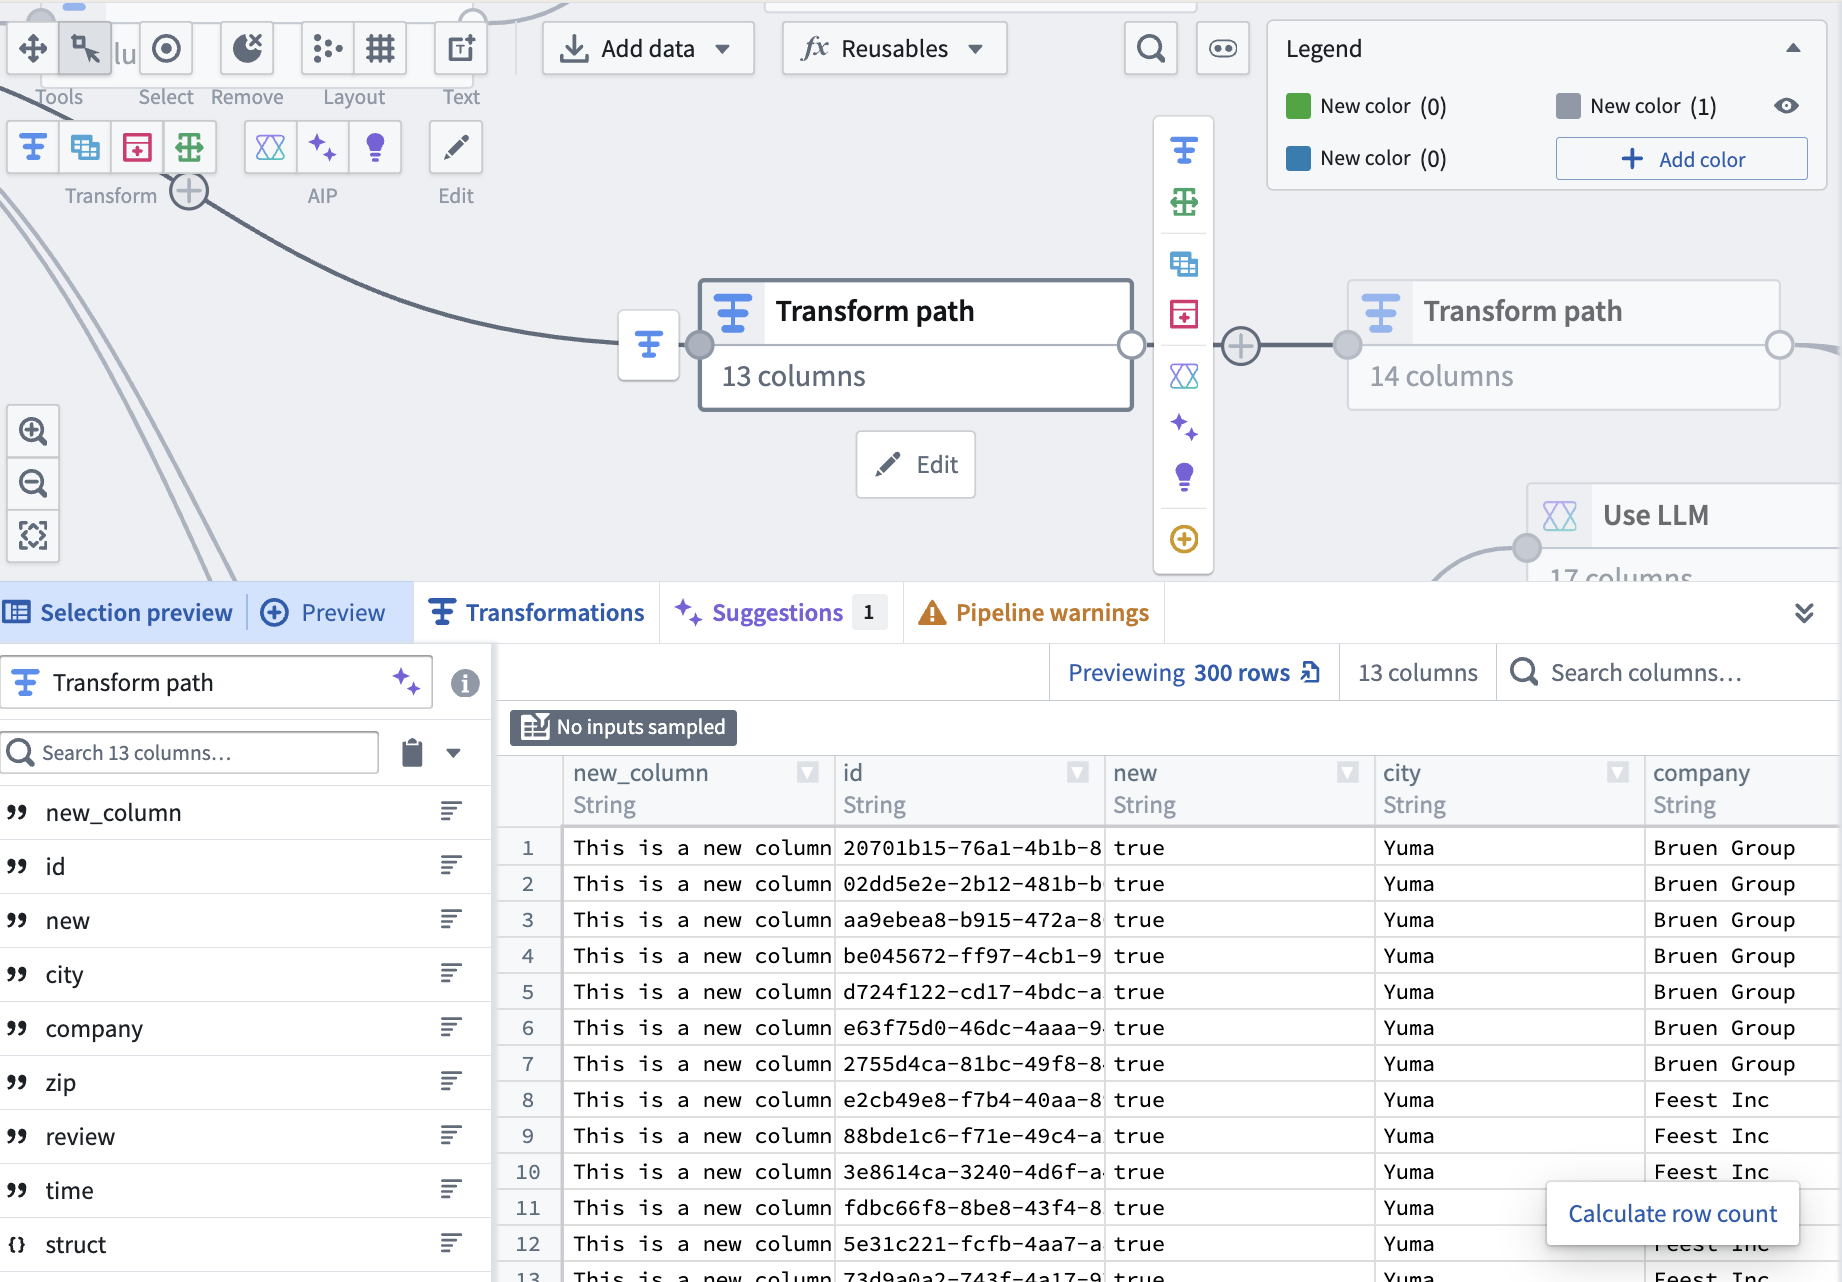
Hey @clinteastwood ! You don’t need to click into each node to calculate the row, you can select it on your graph, and click the “Calculate row count” button in the preview panel
The reason we didn’t want to calculate it in bulk or show it by default (even if it’s a specific setting enabling it) is because it’s computationally expensive and it makes it easy to accidentally run up their compute costs. How often do you normally calculate your row counts? (Before deploy or after any join?)
Hi! Thanks for the rapid response! It may have been a (partly) misleading question, yes one does not have to dive in to the dataset to see the row counts. But what I was curious was instead of clicking in running each one, is it possible to run all on a pipeline at once? I know computation expenses exist if we ran this all the time, but honestly maybe put guardrails in place (if a long pipeline node structure run certain segments, or just keep it to shorter node pipelines). At the end of the day, a good pipeline structure should not be too long.
I do a lot of developing in large complex healthcare datasets, and the cruciality around monitoring row size is paramount. I just wonder if there is a feasibility balance between compute size expenses and large-scale at-once visualization that is easy for the developer to notice discrepancies?
As an alternative, it would be great to have a row count node to position strategically along the pipeline or to feed to an audit table as needed.
I would like to share a workaround I started applying recently.
After each critical transform or join in a pipeline, I do an aggregation on the output table which just counts its rows, then I use an Union to collect this information into a dedicated audit table (dataset) which only has 2 columns:
step description | row count
By numbering the steps 01, 02, etc. I end up with an audit table which can be sorted to show how the row count changes throughout the different steps of the pipeline. The table looks like this:
step description | row count
01 - Initial dataset from X | 1,232,343
02 - JOIN to lookup Division number | 1,232,343
03 - FILTER on Division = Z | 345,134
04 - JOIN to lookup Account Manager | 345,134
05 - FILTER …
Very handy to see if something goes wrong at a certain point.
