Hi there,
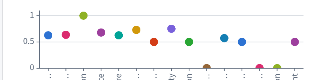
I am trying to write a function that will aggregate and prep my object set for input into a chart XY widget. The chart itself is time (x axis) against score ( y axis) but I’ve been trying to write a ThreeDimensionalAggregation so that I can put it through a loop layout so we have consecutive charts based on each category. The current function I have written begins as follows and I will include an example of the output. The issue is the chart is empty - could you recommend what to look at or what structure the data needs to be in for it to work as a Chart XY input. I have anonymised everything. See image for out which is category (x axis) against score (y axis)
@Function() public async chartXY(categories: ObjectSet<ObjectType>): Promise<ThreeDimensionalAggregation<string, IRange<Timestamp>>> {
{
  "buckets": [
    {
      "key": {
        "string": "category 1",
        "type": "string"
      },
      "buckets": [
        {
          "key": {
            "range": {
              "max": {
                "timestamp": "2025-06-12T00:00:00.000+00:00",
                "type": "timestamp"
              }
            },
            "type": "range"
          },
          "value": {
            "double": 0.1234,
            "type": "double"
          }
        }
      ]
    },
Thanks